Correlation
When the two sets of data are strongly linked together we say they have a High Correlation.
The word Correlation is made of Co- (meaning "together"), and Relation
- Correlation is Positive when the values increase together, and
- Correlation is Negative when one value decreases as the other increases
Like this:

(Learn More About Correlation)
Negative Correlation
Correlations can be negative, which means there is a correlation but one value goes down as the other value increases.
Example : Birth Rate vs IncomeThe birth rate tends to be lower in richer countries.Below is a scatter plot for about 100 different countries. |
|
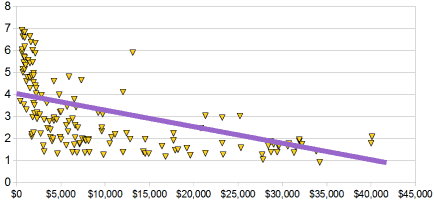
It has a negative correlation (the line slopes down)
Note: I tried to fit a straight line to the data, but maybe a curve would work better, what do you think?
How To Calculate
How did I calculate the value 0.9575 at the top?
I used "Pearson's Correlation". There is software that can calculate it, such as the CORREL() function in Excel or LibreOffice Calc ...
... but here is how to calculate it yourself:
Let us call the two sets of data "x" and "y" (in our case Temperature is x and Ice Cream Sales is y):
- Step 1: Find the mean of x, and the mean of y
- Step 2: Subtract the mean of x from every x value (call them "a"), do the same for y (call them "b")
- Step 3: Calculate: ab, a2 and b2 for every value
- Step 4: Sum up ab, sum up a2 and sum up b2
- Step 5: Divide the sum of ab by the square root of [(sum of a2) × (sum of b2)]
Here is how I calculated the first Ice Cream example (values rounded to 1 or 0 decimal places):

As a formula it is:
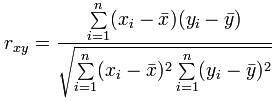
Where:
- Σ is Sigma, the symbol for "sum up"
 is each x-value minus the mean of x (called "a" above)
 is each y-value minus the mean of y (called "b" above)
You probably won't have to calculate it like that, but at least you know it is not "magic", but simply a routine set of calculations.
Note for Programmers
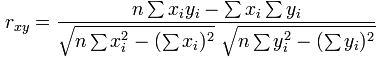
You can calculate it in one pass through the data. Just sum up x, y, x2, y2 and xy (no need for a or b calculations above) then use the formula:
Other Methods
There are other ways to calculate a correlation coefficient, such as "Spearman's rank correlation coefficient".
Comments
Post a Comment