The line fits the scatter diagram well.
If the scatter diagram shows a linear trend upward or downward then it is useful to compute the least squares regression line and use it in predicting y. Figure 10.12 "Same Scatter Diagram with Two Approximating Lines" illustrates this. In each panel we have plotted the height and weight data of Section 10.1 "Linear Relationships Between Variables". This is the same scatter plot as Figure 10.2 "Plot of Height and Weight Pairs", with the average value line superimposed on it in the left panel and the least squares regression line imposed on it in the right panel. The errors are indicated graphically by the vertical line segments.
Figure 10.12 Same Scatter Diagram with Two Approximating Lines
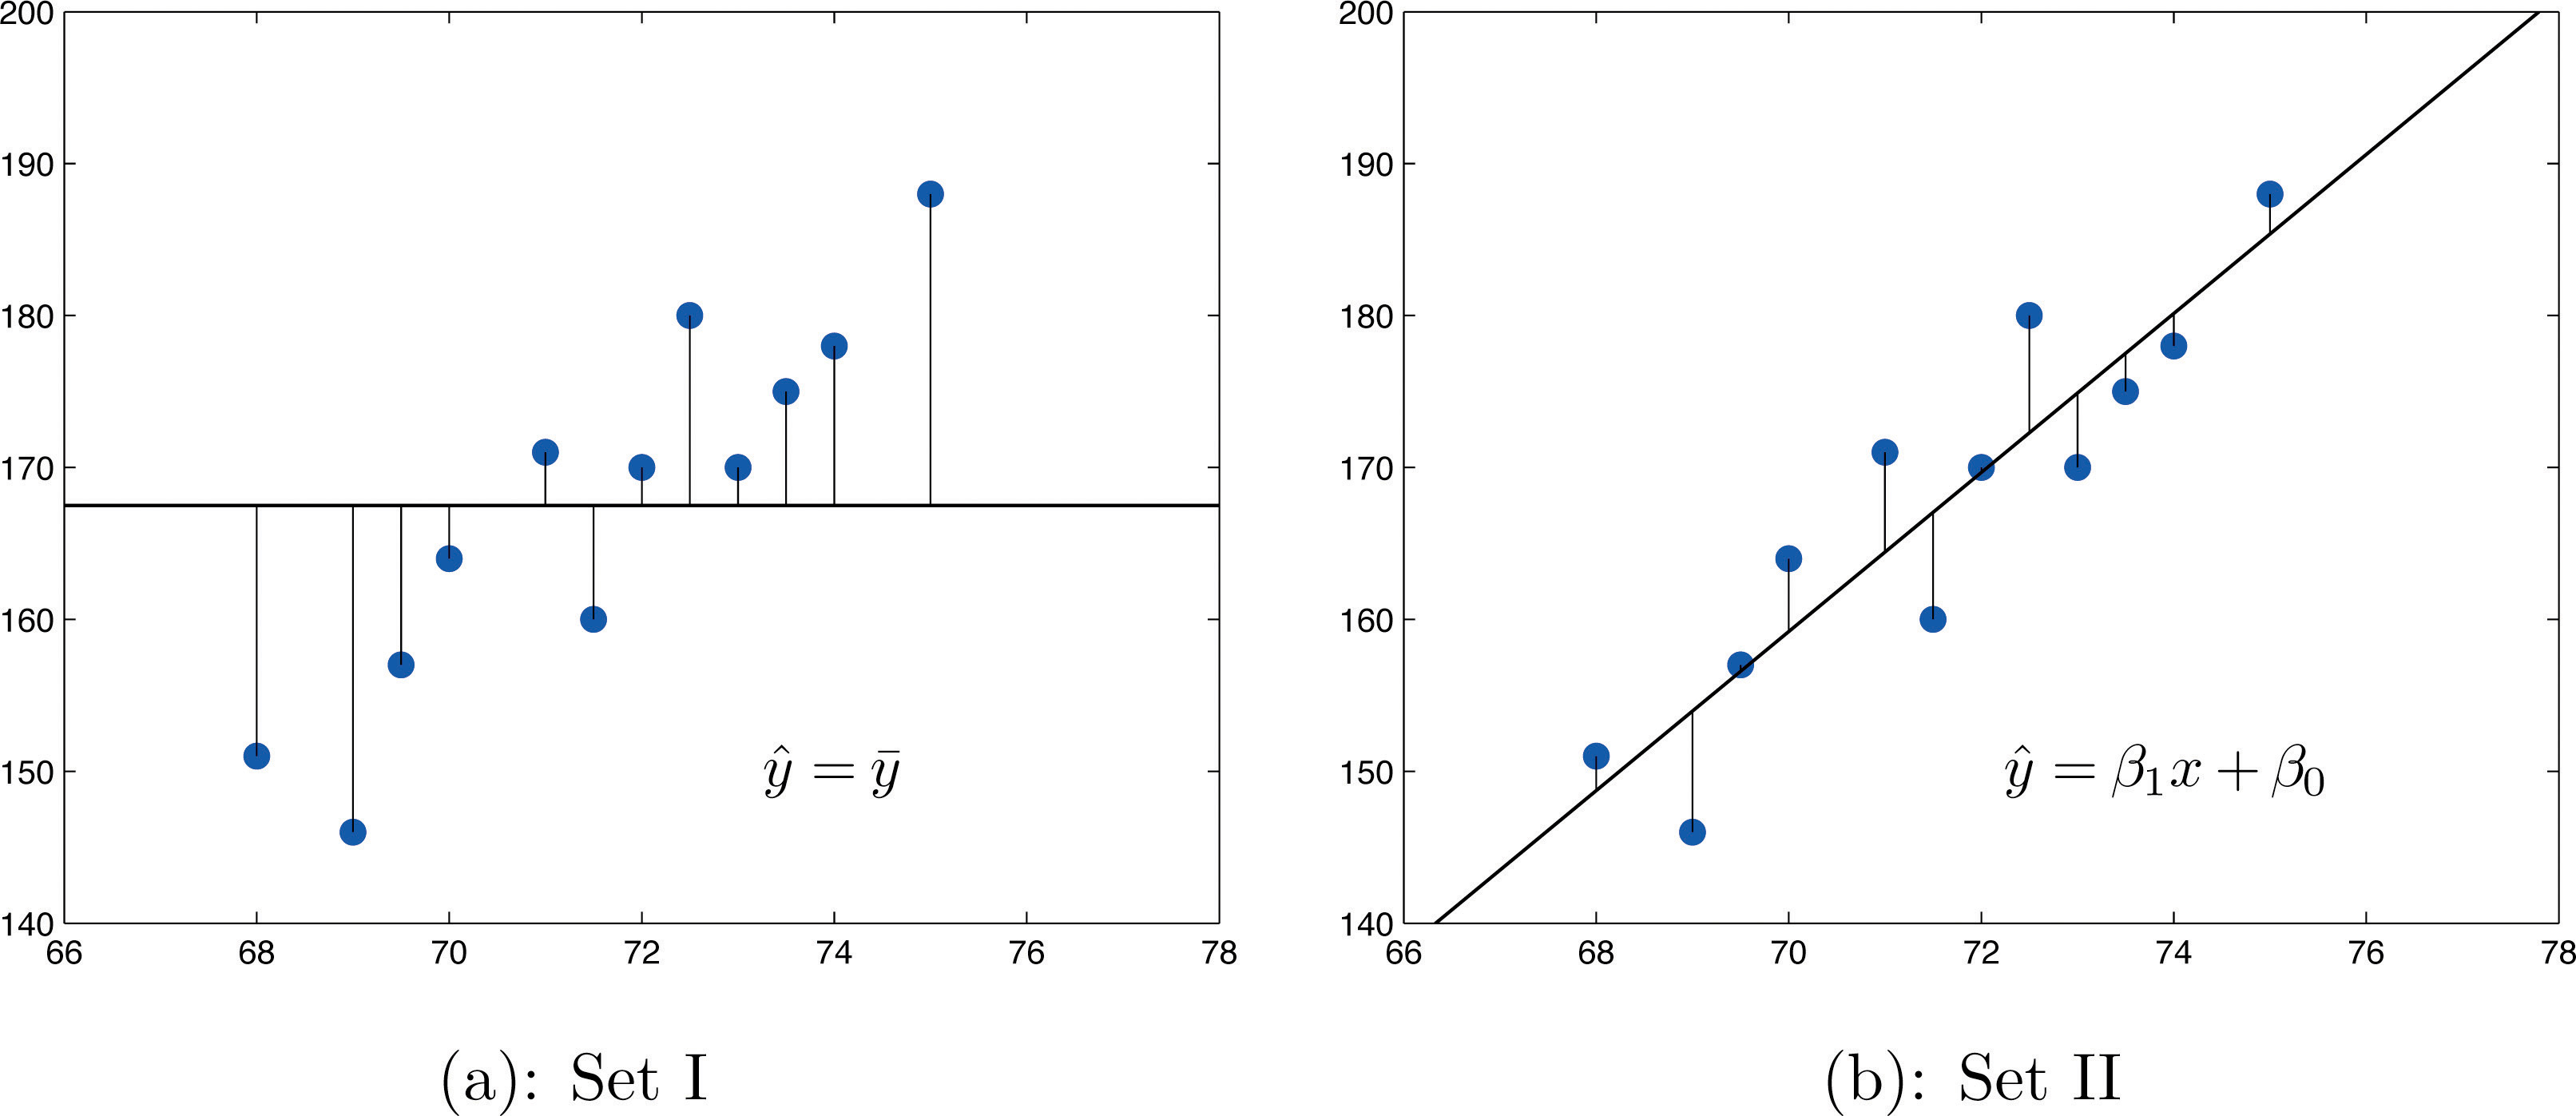
The sum of the squared errors computed for the regression line, , is smaller than the sum of the squared errors computed for any other line. In particular, it is less than the sum of the squared errors computed using the line , which sum is actually the number that we have seen several times already. A measure of how useful it is to use the regression equation for prediction of y is how much smaller is than In particular, the proportion of the sum of the squared errors for the line that is eliminated by going over to the least squares regression line is
Negative Result
If the result is negative, that means that our prediction is worse than the simple 'Mean' of the sample (the average). Which means a bad prediction.
Positive Result
If the result is positive, that means that our prediction is better than the simple 'Mean' of the sample (the average). Which means a good prediction.
Zero Result
If the result is zero, that means that our prediction the same as the simple 'Mean' of the sample (the average). Which means a bad prediction also.
Comments
Post a Comment