Normal Distribution
Data can be "distributed" (spread out) in different ways.
| It can be spread out more on the left | Or more on the right | |
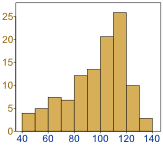 | 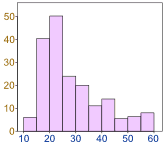 | |
| Or it can be all jumbled up |
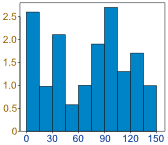 |
But there are many cases where the data tends to be around a central value with no bias left or right, and it gets close to a "Normal Distribution" like this:

A Normal Distribution
The "Bell Curve" is a Normal Distribution.
And the yellow histogram shows some data that
follows it closely, but not perfectly (which is usual).
And the yellow histogram shows some data that
follows it closely, but not perfectly (which is usual).
 | It is often called a "Bell Curve" because it looks like a bell. |
Many things closely follow a Normal Distribution:
- heights of people
- size of things produced by machines
- errors in measurements
- blood pressure
- marks on a test
We say the data is "normally distributed":

The Normal Distribution has:
Quincunx
| You can see a normal distribution being created by random chance! It is called the Quincunx and it is an amazing machine. Have a play with it! | 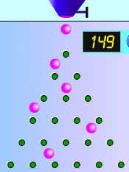 |
Standard Deviations
The Standard Deviation is a measure of how spread out numbers are (read that page for details on how to calculate it).
When we calculate the standard deviation we find that generally:
 | 68% of values are within 1 standard deviation of the mean 95% of values are within 2 standard deviations of the mean 99.7% of values are within 3 standard deviations of the mean |
Comments
Post a Comment